

GeoSea: one geoportal for marine data
A geoportal that brings fish market, fleet, habitat and economic data from open sources into one interactive interface.
Marine science and fisheries managementDo it for youGeoportalOpen dataFisheries
Challenge
Marine science produces enormous amounts of data, but it lives in dozens of separate places: market data on one portal, habitat layers on another, vessel records on a third. A manager who wants to compare catches, habitats, fleet and prices has to download five datasets in five formats and assemble them by hand before any analysis can begin. This is not a data shortage, it is a data access problem.
What we built
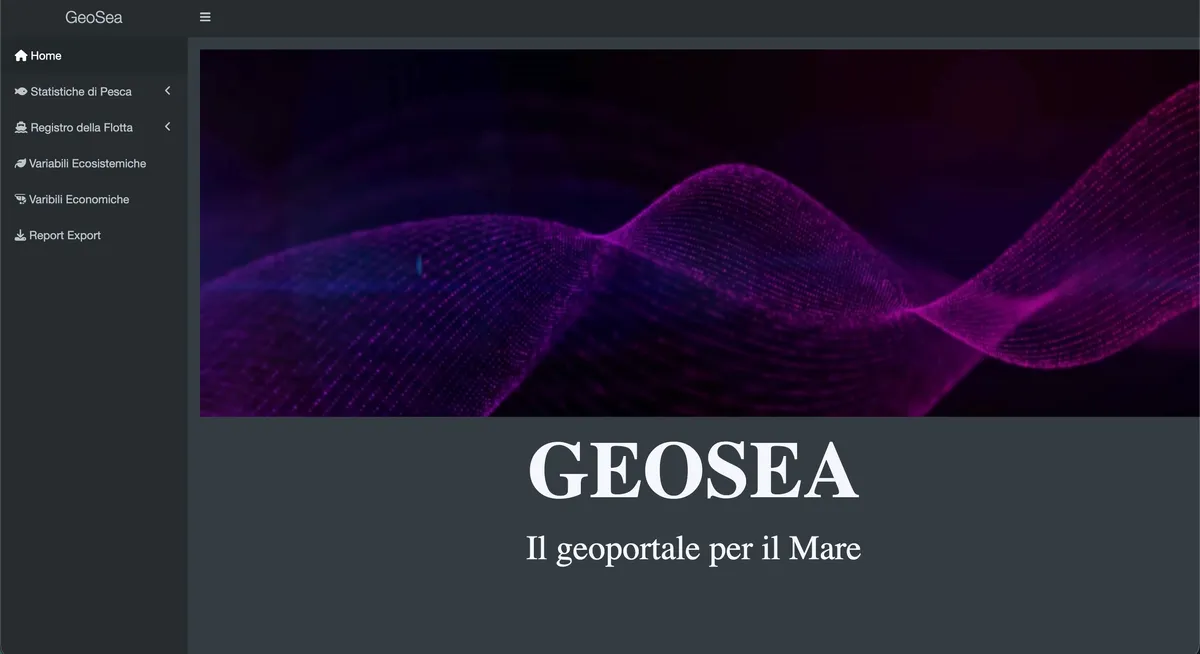
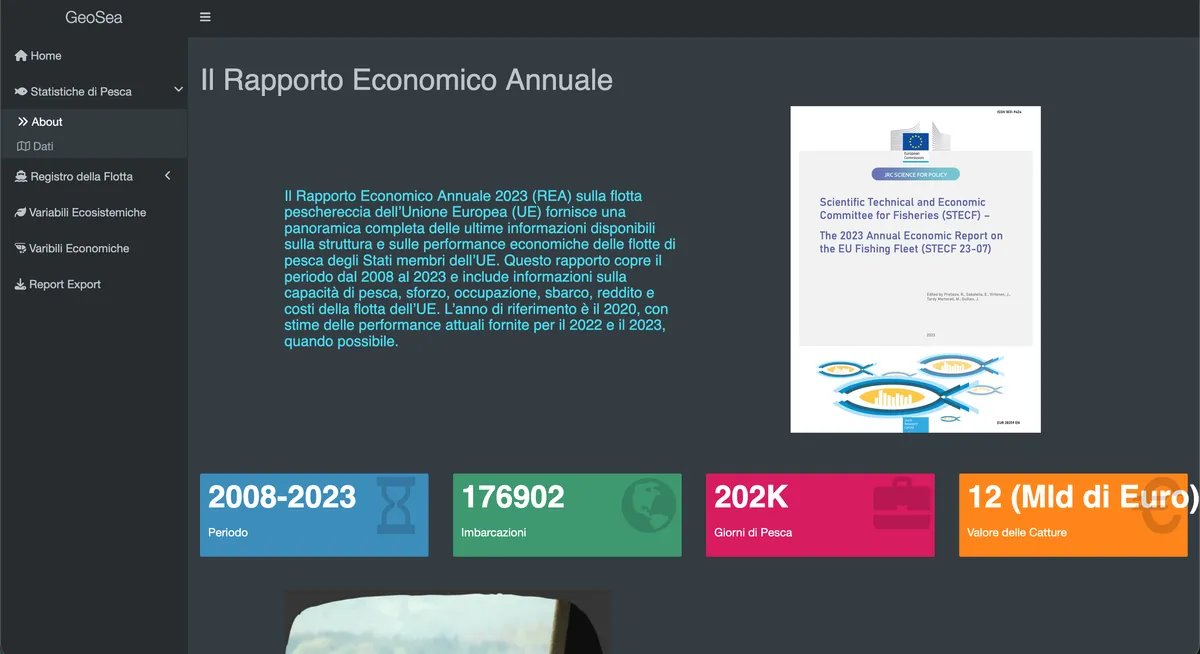
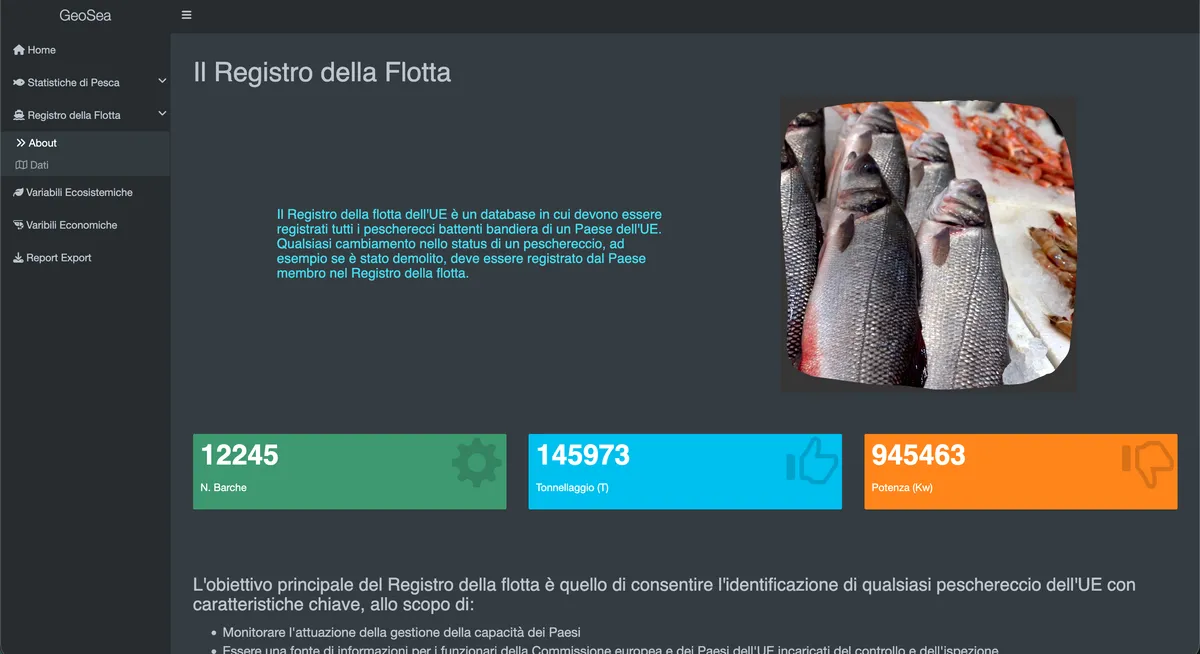
GeoSea is a web geoportal built as an R Shiny application. It aggregates open data from EMODnet, EUMOFA, the EU Fleet Register, the STECF Annual Economic Report and ISTAT.
Users do not download data and process it elsewhere. They pick a species group, an area, a period, a vessel segment or an ecological layer, and the visualisation is built on the fly.
Key features
- Unified data access. Biological, ecological, economic and fleet data from authoritative open sources in one interface.
- Interactive filtering. Choose a fishing area, gear type, vessel segment, period and variable, and the charts update at once.
- Clickable map of Italy. The standard Mediterranean management areas are the spatial entry point to every data layer.
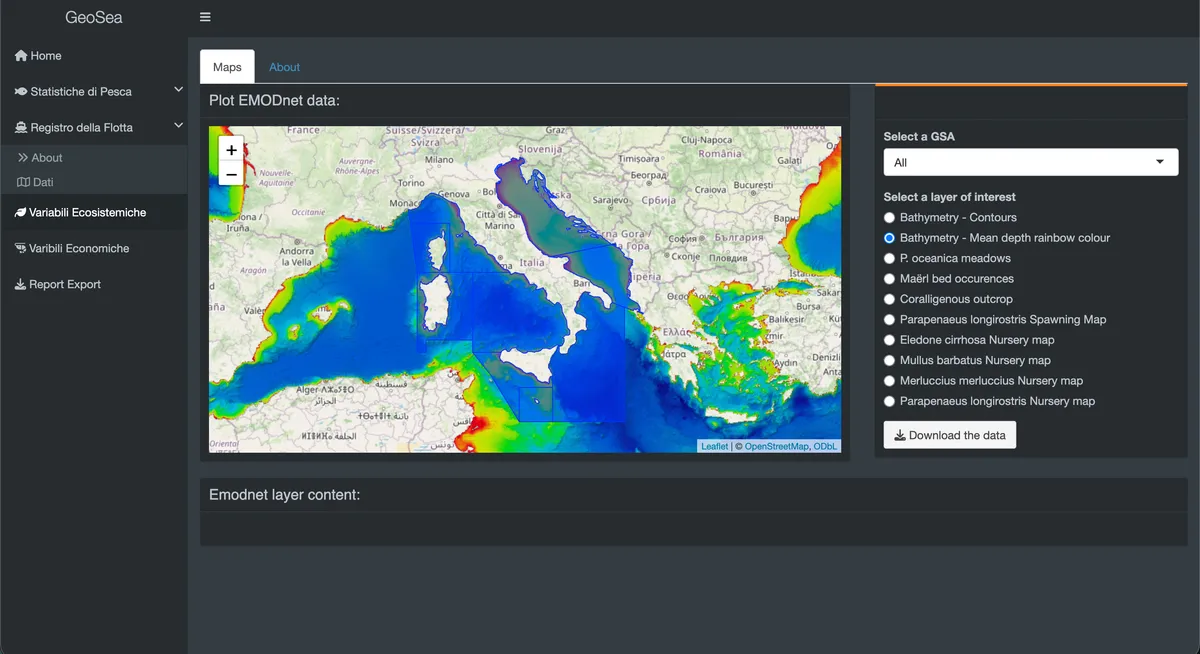
- Ecosystem layers. EMODnet layers such as bathymetry, seagrass meadows, coralligenous habitats, Essential Fish Habitat and protected species.
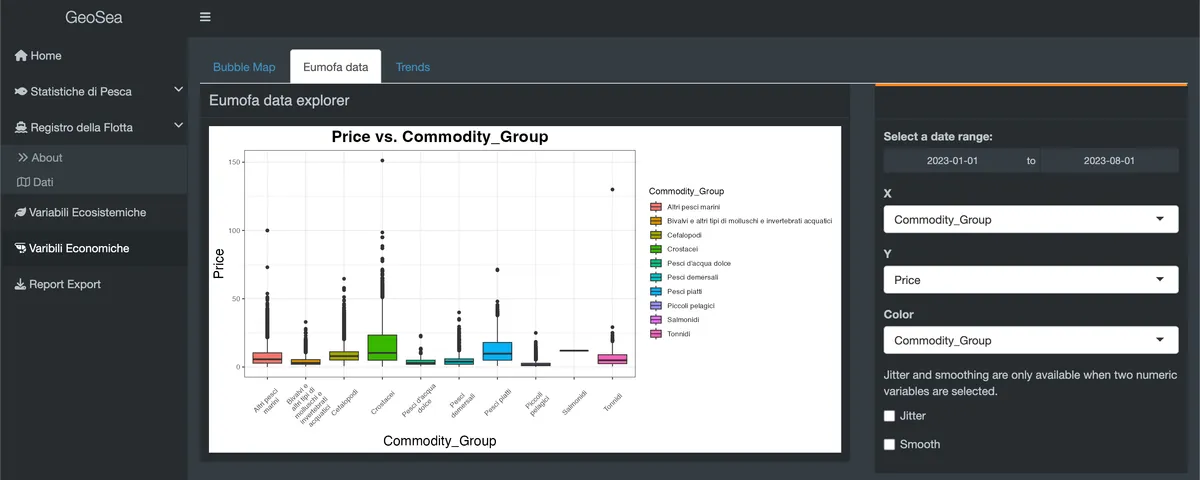
- Economic module. EUMOFA price, trade and volume series by commodity group, weekly, monthly and annual.
- Automated reports. Export a personalised PDF or spreadsheet for any combination of data and period.
How it works
- Requirements came from a structured questionnaire sent to researchers, managers and institutional users.
- R Shiny was chosen for reactive web applications, with a modular structure that is easy to extend.
- Open data from EMODnet, EUMOFA, the EU Fleet Register, the STECF economic report and ISTAT was harmonised into a geospatial database with standard schemas.
- The interface combines filters, charts, Leaflet maps and data tables.
- EMODnet layers became toggleable map overlays.
- Cross source logic lets variables from different datasets share one chart, which surfaces relationships invisible when the data stays in separate portals.
- A report module and an update pipeline keep the time series current.
Screenshots
Outcome
Data that used to need several portals, several formats and manual assembly can now be explored in minutes, without writing code. Researchers get trend data for publications, managers a fast overview, and policy advisors visuals they can use to explain complex dynamics. After launch we kept supporting the portal and extended it through updates and new implementation work.
Scientific context
GeoSea was developed under Italy's National Three Year Plan for Fisheries and Aquaculture. It puts into practice the idea that good governance needs not only good data but accessible data: the gap between scientific knowledge and decisions is often a usability problem, not an availability problem.
RShinyLeafletEMODnetEUMOFAPostgreSQLPostGIS