

smartR: test a fishing closure before it happens
An open source R package that simulates how a spatial closure would change fishing effort, stocks and fleet income before any rule is written.
Fisheries management, EU researchDo it for youBioeconomic modellingSpatial analysisOpen source
Challenge
Demersal trawl fisheries are among the hardest to manage, because what matters is not only how much is caught but where and when. Managers lacked a way to see which areas to protect and what protection would cost fleets. Existing tools lacked spatial detail, ignored mixed catches or needed proprietary software. The data already existed: vessel tracking, scientific surveys and landing records. What was missing was a tool to connect them.
What we built
smartR implements the SMART model (Spatial MAnagement of demersal Resources for Trawl fisheries) as an open source R package with a graphical interface.
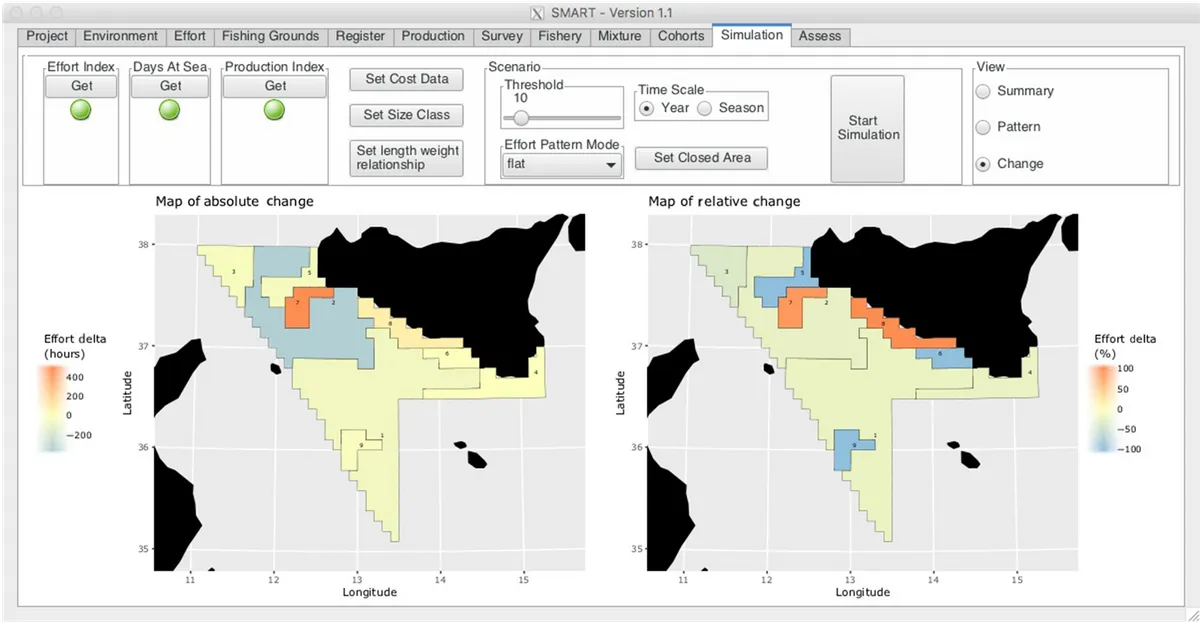
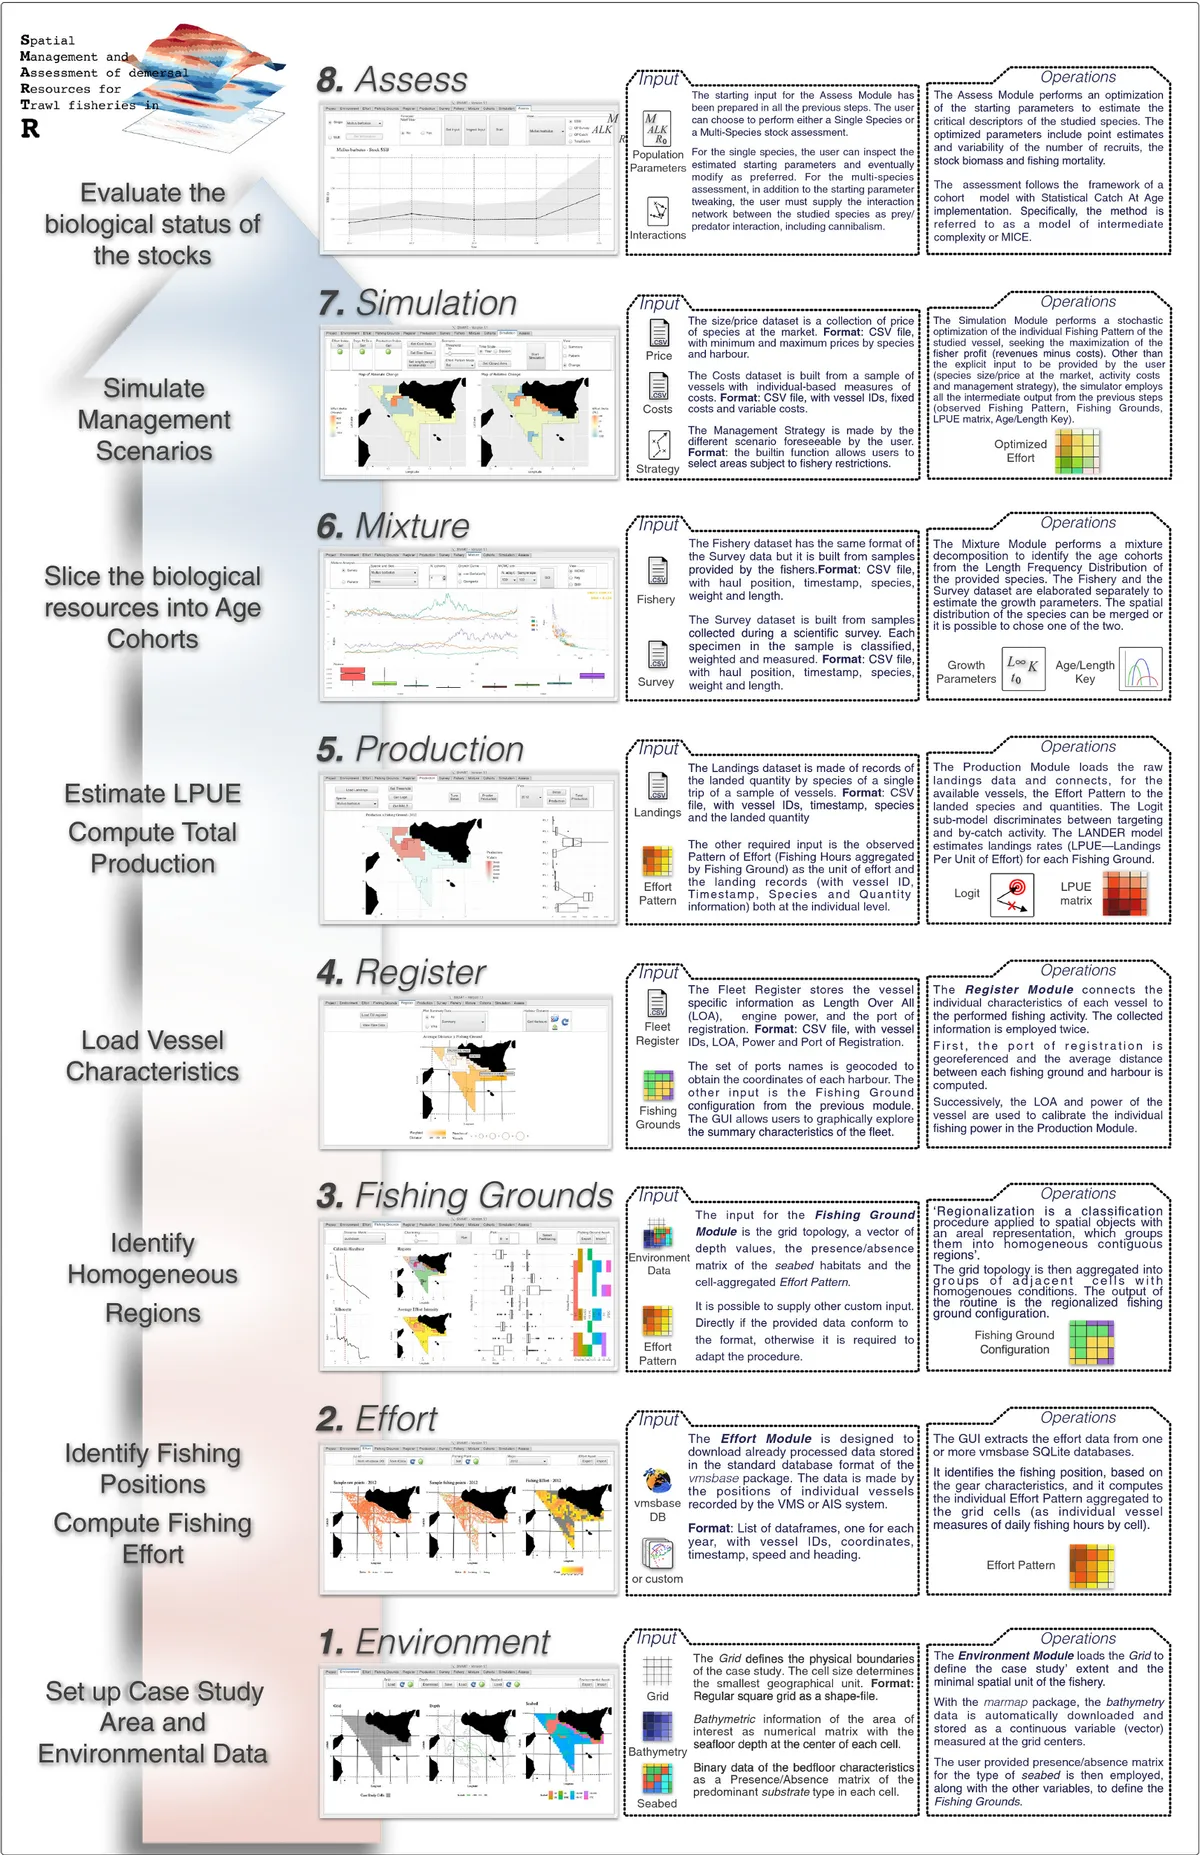
From raw vessel tracking, survey and landing data, an eight step workflow shows where fishing effort could be redistributed to protect stocks while limiting economic harm. An analyst defines a closure, runs a simulation for each vessel, and sees projected changes in biomass, fishing mortality, revenue and cost. The whole chain is reproducible in R.
The same modelling approach grounded our bioeconomic displacement work for offshore wind projects.
Key features
- Spatial effort mapping. Turns vessel tracking data into gridded fishing hours.
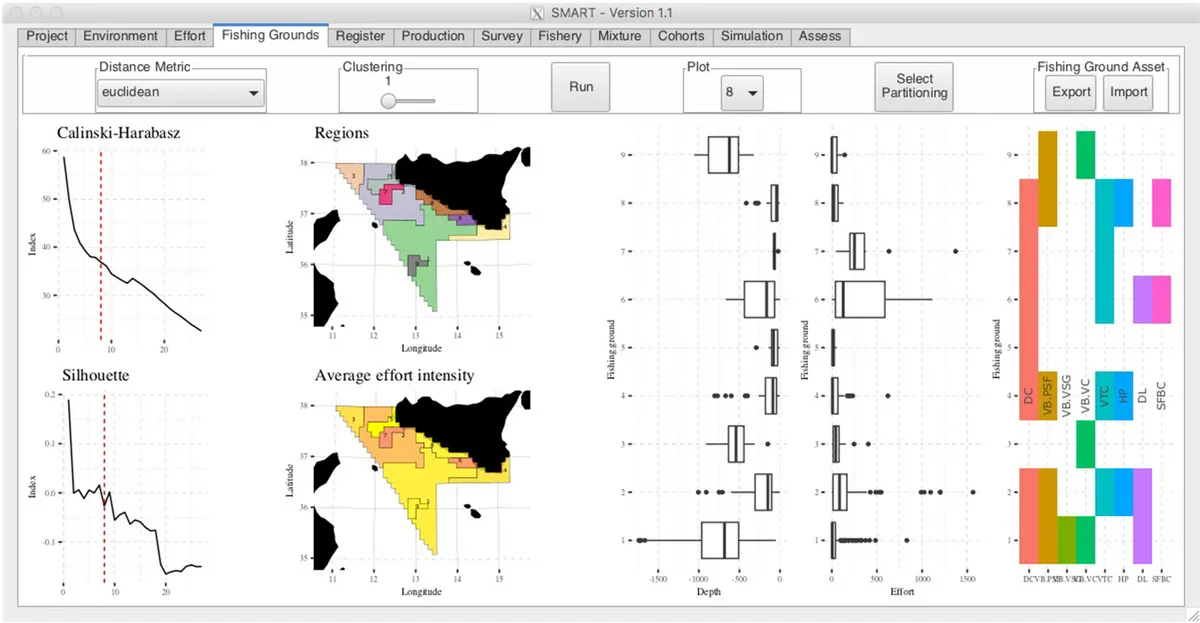
- Fishing ground detection. Clusters effort, depth and seabed type into homogeneous fishing grounds.
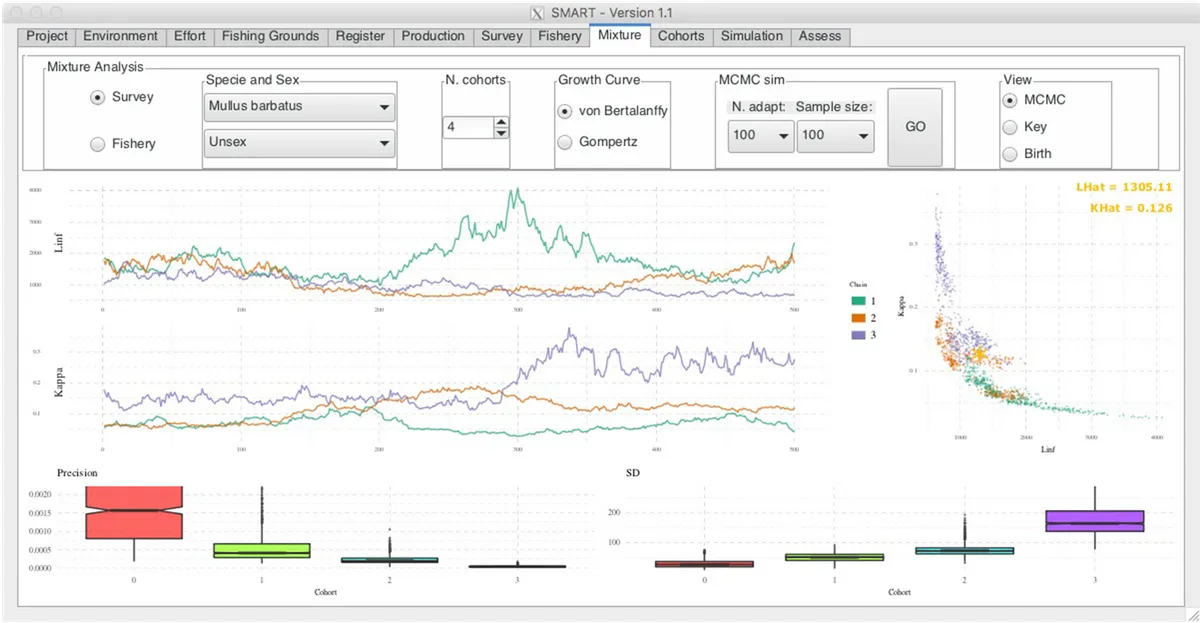
- Cohort decomposition. A Bayesian method reconstructs age structure from length data.
- Vessel level simulation. A stochastic, profit maximising model shows how each vessel redistributes effort under a closure.
- Stock assessment. A cohort model estimates recruits, fishing mortality and stock biomass.
- Trophic interactions. Models predator and prey relationships between exploited species.
- Fully open. Every object stays accessible in R, and the package can be customised under the GPL.
How it works
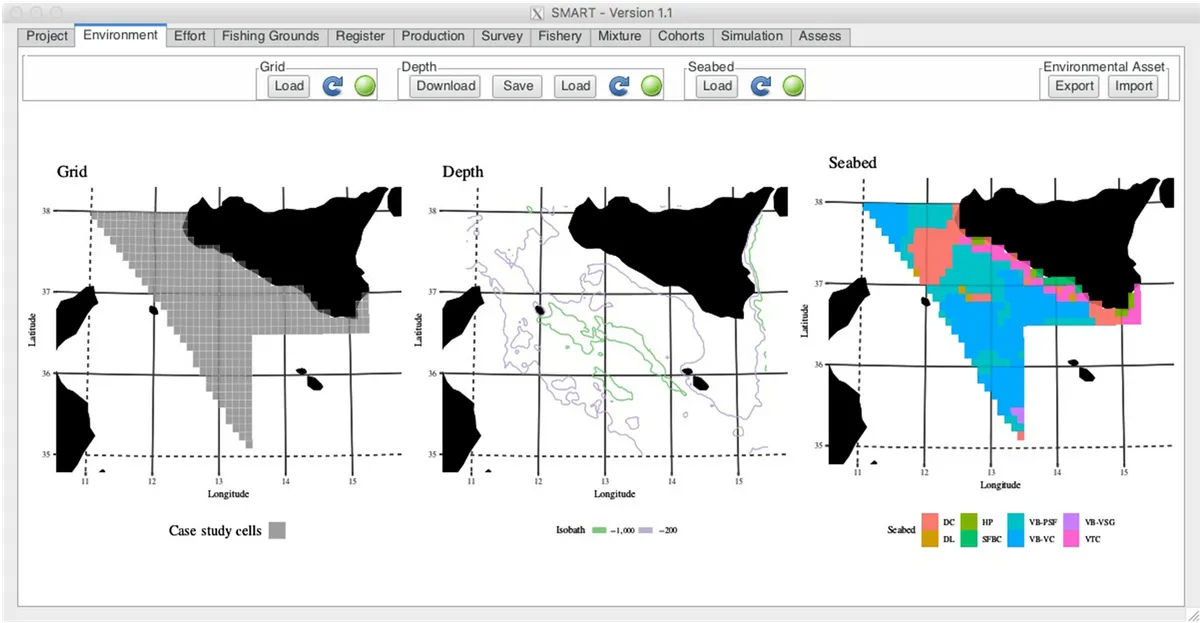
- Environment: set up the study grid, depth and seabed layers.
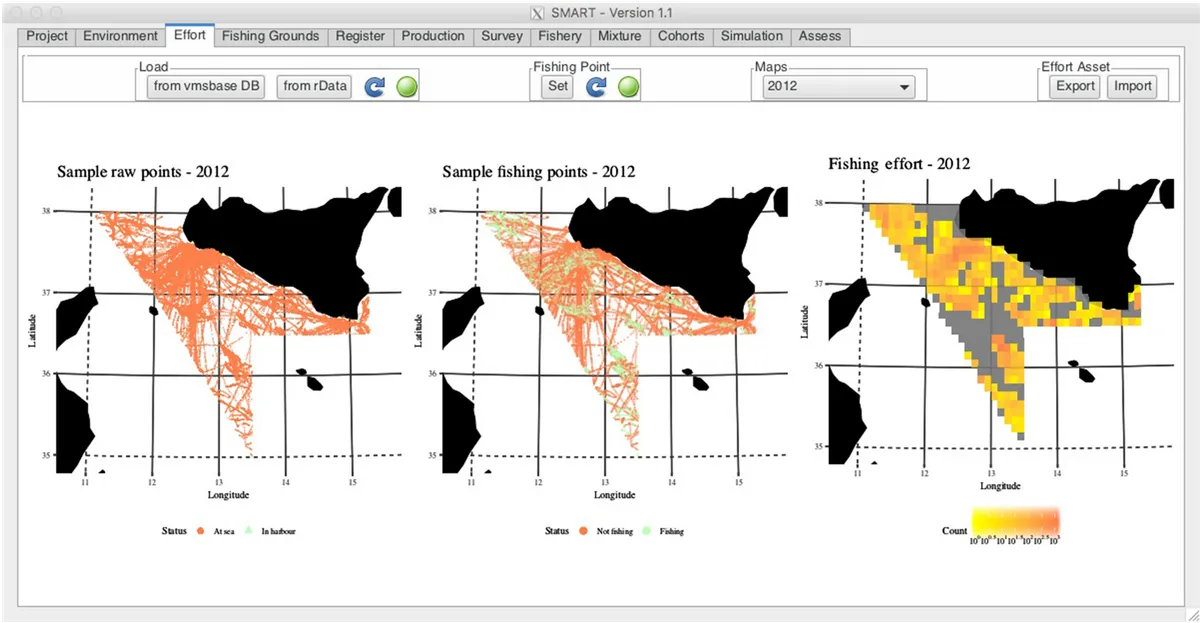
- Effort: extract vessel tracks, identify fishing positions and aggregate them to fishing hours.
- Fishing grounds: cluster cells into homogeneous zones with spatial clustering.
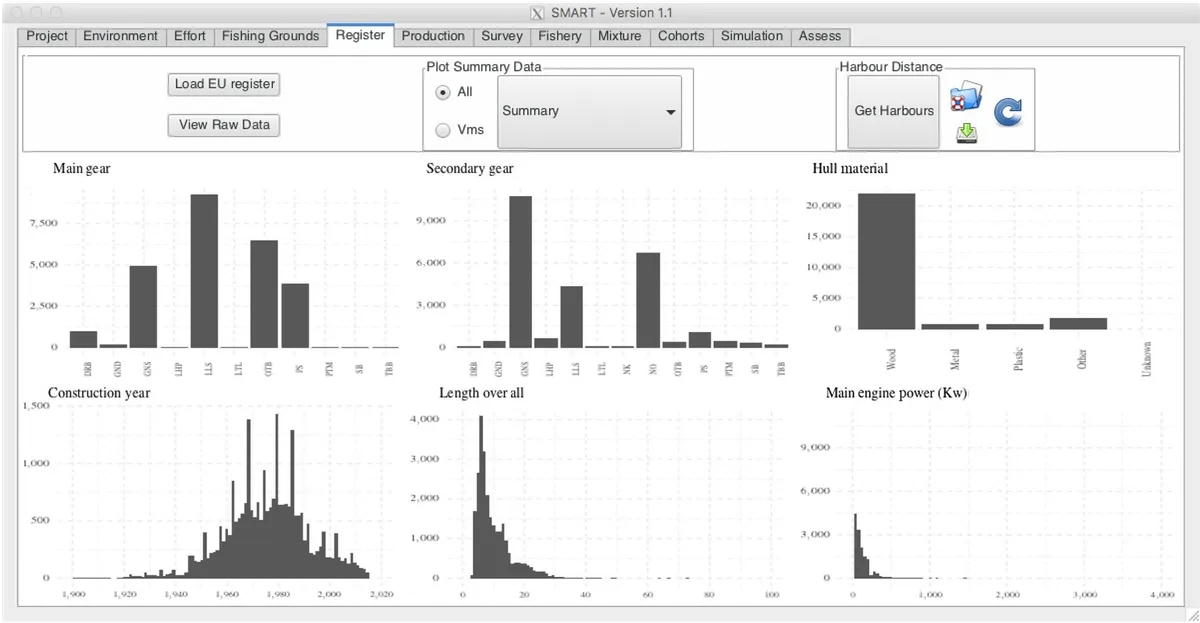
- Register: load vessel characteristics and compute distances from harbours to grounds.
- Production: join landings to effort and estimate catch rates per ground.
- Mixture and cohorts: split length distributions into age cohorts.
- Simulation: define a strategy such as a closure, with costs and prices, and run the vessel level simulation.
- Assess: feed simulated landings into a stock assessment.
Screenshots
Outcome
Managers get a quantified preview of what a proposed closure would mean for fish stocks and fleets before it is enacted, and researchers get an inspectable workflow instead of a black box. Compared with analogous spatial fisheries modelling suites, smartR is the only one combining mixed fisheries, trophic interactions and vessel level displacement in a single open source package.
Scientific context
smartR was developed within the MANTIS project (Marine protected Areas Network Towards Sustainable fisheries in the Central Mediterranean), funded by the European Commission, DG MARE. It supports the Ecosystem Approach to Fisheries by letting analysts design and evaluate fishery restricted areas before they are deployed. Publication: D'Andrea L et al. (2020), Methods in Ecology and Evolution 11, 859 to 868.
RJAGSvmsbasespdepmarmapR6MCMCGIS
Figures from the published paper.