
Escaping Data Chaos
Also on LinkedIn
This article was first published in the Escaping Data Chaos series. The stories in the series are composites of real projects, anonymised.


Blog / Data Work
6 March 2026
Data Work: the effort that starts from zero every cycle.
You have cleaned your data. Now comes the part that eats your weeks. Every analysis starts from scratch. Last year's scripts are gone, the statistics are rebuilt by hand in Excel, and a report that should take an hour takes three weeks. One person knows how to do it. When they leave, years of knowledge leave with them.
This is not a people problem. It is an infrastructure failure that looks like normal workflow. This post shows how to analyse environmental data without starting over each cycle, through the four breaking points in data work and what fixes them.
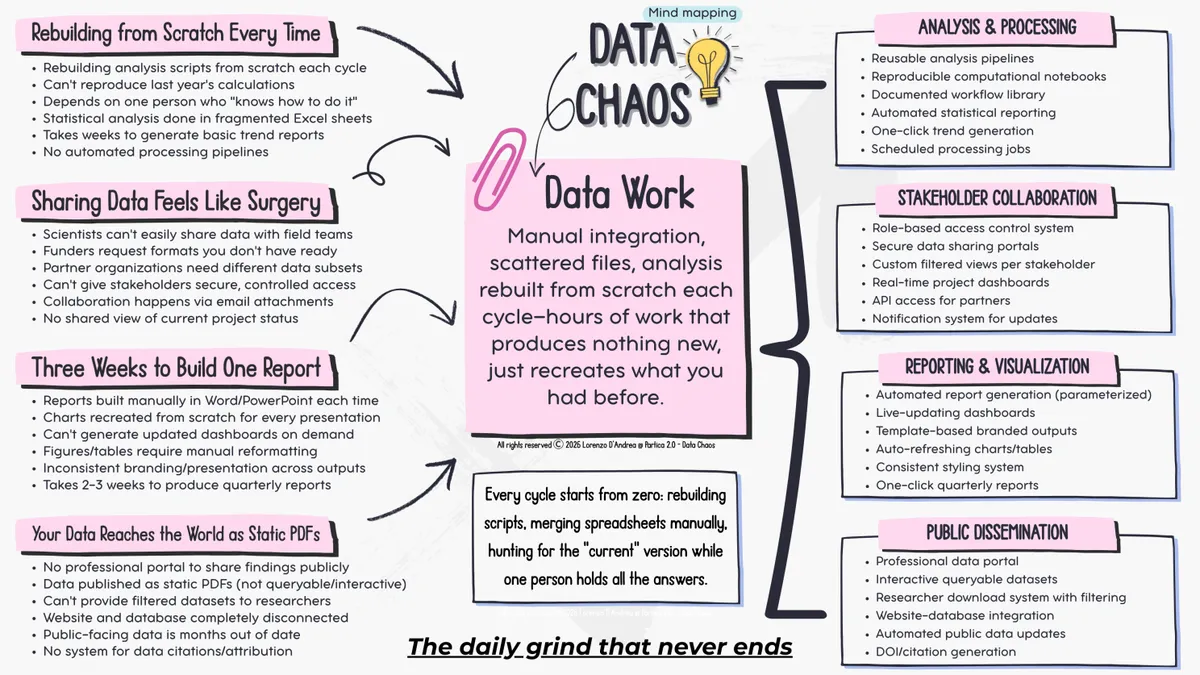
Scripts vanish between cycles. Statistics live in scattered Excel sheets, and nobody can reproduce last year's numbers.
A coastal monitoring team ran the same statistical analyses every quarter for five years. Every quarter, the lead analyst rebuilt the calculations from scratch in Excel, because the workflow was never written down. When she went on maternity leave, her replacement spent six weeks working out which formulas to use. The team had five years of reports and no record of how the numbers were calculated. When she came back I asked why she never automated it. She said she kept meaning to, but there was always a deadline.
The fix is to write the workflow once as code, using open source environmental data tools such as R or Python. Include every calculation, every test and every transformation. Next quarter you run the script on the new data and have results in minutes instead of rebuilding from memory. Knowledge becomes code, not memory.
Scientists cannot easily share data with field teams. Funders ask for formats you do not have, partners need different subsets, and everything moves as email attachments.
A marine protected area team I worked with had twelve stakeholder groups. The fisheries department wanted catch data in one format, the tourism ministry needed other measures, local communities wanted readable summaries and research partners wanted raw data. Every request meant manual extraction, reformatting and weeks of email. One stakeholder asked for updated numbers three times in a month because they kept losing the attachment. By the third request the coordinator spent more time reformatting data than managing the programme.
The fix is one system where each group logs in and sees its own view. Fisheries sees catch statistics that update themselves. Communities see visual summaries. Research partners download filtered datasets. You build it once and they use it for good.
Every quarterly report is rebuilt by hand. Charts are redrawn, figures are reformatted and the branding drifts. This is where I see teams burn out fastest.
A biodiversity monitoring programme spent weeks every quarter pulling numbers into donor reports. They copied data from the database into Excel, made charts, formatted tables, built a presentation, pasted charts into a Word file, fixed the layout and exported PDFs, every single quarter. The programme manager told me she spent more time making reports than working out what the data meant.
The fix is simple environmental reporting software: one template that reads directly from your database. Charts and tables refresh on their own, the branding stays fixed, and you click to generate a formatted document. Stakeholders who need current numbers get a dashboard instead of a quarterly PDF. Start with your most painful recurring report. One automated template creates momentum for everything else.
There is no professional portal. Findings are published as static PDFs that cannot be queried, the website is disconnected from the database, and public data is months out of date.
A research institute held a decade of water quality data that researchers kept requesting. Each request meant manual extraction, anonymisation checks, format conversion and an email, more than 40 hours a month for data the institute wanted to be public anyway. Meanwhile its website showed summary reports six months old, because updating it meant exporting new numbers and having someone rebuild the page.
The fix is a public portal where researchers query and download data themselves. Add interactive maps of the monitoring sites, time series people can explore, automatic updates and proper DOIs for citation. Your data becomes findable and professional without manual work for each request.
These breaking points share one pattern: heroic effort that does not compound. Every cycle starts from zero. Scripts are rebuilt, spreadsheets are merged by hand, and people hunt for the current version while one person holds all the answers. The results are accurate, but they take far longer than they should because nothing carries over.
One team built a single automated reporting pipeline, and its stakeholders now open live dashboards whenever they need an update. That saves time, but it also shows capability, builds credibility with funders and makes the difference between answering a grant call in hours or in weeks.
Fix these points one by one and your work finally accumulates. Analysis improves instead of resetting, collaboration happens by itself and reports appear on demand. Your expertise becomes visible at the speed funders and partners need to see it.
Escaping Data Chaos
This article was first published in the Escaping Data Chaos series. The stories in the series are composites of real projects, anonymised.
Keep reading
Start here
Data In
Data Work
Data Out
Data Out
From the case studies
Fisheries, EU research
Fisheries and marine research

Aquaculture and capacity building
Case studies
Where to go next