
Escaping Data Chaos
Also on LinkedIn
This article was first published in the Escaping Data Chaos series. The stories in the series are composites of real projects, anonymised.


Blog / Data In
27 February 2026
Data In: how errors enter early and compound at every step.
The chaos does not start in your analysis or your reporting. It starts the moment data enters your system. I have mapped four points where intake breaks down. Here is what they look like, and which environmental data collection methods fix them.
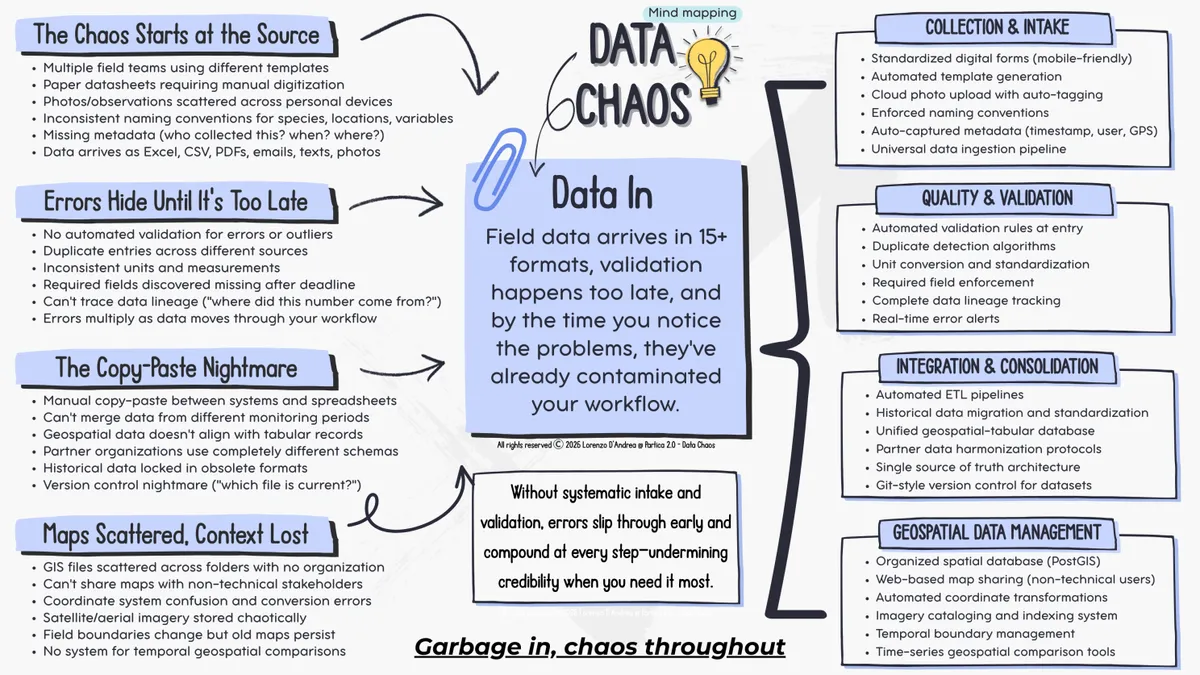
Field observations arrive in fifteen formats. One team uses Excel, another paper datasheets, a third sends photos from a phone. Species names are written three ways across three projects. GPS coordinates use different systems, and the notes on who collected what, when and where are gone.
You are behind before the analysis starts. By the time someone sees a validation error, it has spread. You spend hours reconciling formats when you should be analysing ecosystems.
Several field teams use different templates. Paper sheets need typing up. Photos and notes sit on personal phones. There are no shared environmental data standards, so names for species, places and variables change from team to team, and metadata goes missing.
One marine monitoring programme had teams in three countries, each with its own method built up over years. For a major EU grant report they spent six weeks just merging the datasets. The same sea urchin was recorded as Paracentrotus lividus in one database, as P. lividus in another and as "sea urchin" in a third. Every record needed manual reconciliation.
The fix is standard digital forms and an intake pipeline that accepts anything and produces one consistent format. Build mobile forms that enforce naming at entry, and capture time, user and GPS position automatically. The effort goes into building the system once, not into reconciling formats forever.
Without automatic checks, errors and duplicates hide until a presentation. Units differ, required fields turn out to be empty after the deadline, and nobody can trace where a number came from.
A biodiversity team once presented preliminary findings to a ministry review panel. In the middle of the presentation they found that half their GPS points were in the wrong hemisphere, because one team's devices were set up wrongly. The data looked fine in a spreadsheet. Nobody noticed until someone plotted the points on a map during the meeting.
The fix is validation at entry. Put range checks on every numeric field, flag duplicates at once, and check coordinates against the study area. Alert field teams while they are still on site and can resample. Catch errors at the source, not months later in front of funders.
Data is copied by hand between systems. Monitoring periods cannot be merged, partners use different schemas, and old data sits in obsolete formats.
A coastal monitoring programme had five years of water quality data that it could not analyse as a time series, because each year used a different Excel template with different column names and units. Salinity was in PSU one year and parts per thousand the next. Temperature was in Celsius, then in Fahrenheit. Every analysis across several years began with weeks of manual harmonisation.
The fix is an automated pipeline that takes data from any source, converts it to your standard schema and loads it into one database. Moving the history is painful once, and then it is done. Partner data is harmonised as it arrives, and version control takes care of itself because there is only one current version.
Map files are scattered across folders with no order. Coordinate systems get confused, boundaries change while old maps stay in use, and people who do not use GIS cannot see any of it.
I have seen teams with hundreds of shapefiles named things like "final_v2_FINAL_actualfinal.shp". Nobody knew which boundary was current. When they had to show stakeholders where sampling took place, it took three days to find the right files and work out their coordinate system.
The fix is a spatial database such as PostGIS, with automatic coordinate transformations and web maps that stakeholders open without GIS software. Keep dates on your spatial layers, so you can compare where you sampled in 2020 with where you sampled in 2024 without searching folders.
These failures are invisible until they are expensive. Bad intake looks fine when one person runs one project. It breaks when you grow to more teams, more years or more funders, and by then you have thousands of inconsistent records and a deadline in two weeks.
The answer is not one heroic clean up. It is intake that makes consistency automatic. Start with the point that hurts most, usually collection or validation, because they create work in every cycle. Build one standard form, add one validation rule, get one pipeline working. That first fix shows you what is possible, and then you take on the others.
Your field teams collect remarkable observations. Make sure your intake does not turn them into reconciliation work.
Escaping Data Chaos
This article was first published in the Escaping Data Chaos series. The stories in the series are composites of real projects, anonymised.
Keep reading
Start here
Data In
Data Work
Data Out
Start here
From the case studies
Marine litter, citizen science
Fisheries management, EU research

Aquaculture and capacity building
Case studies
Where to go next