
Escaping Data Chaos
Also on LinkedIn
This article was first published in the Escaping Data Chaos series. The stories in the series are composites of real projects, anonymised.


Blog / Data Work
3 April 2026
Forty three files, the most useful one named AAAAA.R, and eight weeks to work out which script did what.
Every cycle, you rebuild it from scratch. The analysis did not change and the data did not change. Nobody ever wrote down how it was done. Analysis and processing is where scientific expertise quietly turns into organisational fragility, one undocumented workflow at a time. Good environmental data science is reproducible by someone who was not there when it was built.
A water quality monitoring programme I know had run the same set of statistical analyses every quarter for six years: trend detection, threshold exceedance rates, seasonal decomposition. The methods were solid and the funders were consistently satisfied.
One analyst had built all of it, gradually, over dozens of Friday afternoons when she had a spare hour and a problem to solve. The scripts lived on her laptop, the logic lived in her head and the documentation lived nowhere. When she left for a university post, her replacement inherited a folder called "analysis_scripts" with forty three files, named things like final_v2_USE_THIS.R and final_v3_actually_final.R, and one simply called AAAAA.R with no explanation.
He spent eight weeks working out which script did what, in which order, on which input files. During that time the quarterly report was three months late and the funder sent two formal inquiries. The director apologised in a way that cost credibility the programme had not fully recovered a year later. The science had not changed. The infrastructure had never existed.
Scripts vanish between cycles. Code written to solve an immediate problem is rarely documented. It works, the deadline passes and the file is saved somewhere loosely logical. Six months later nobody remembers which version was final, what format the input needs or why that one mysterious filtering step exists. The knowledge is the analyst, not the code.
There is one analyst who knows how. Every team has one. They are not hoarding anything. The system never forced them to write things down, and answering questions is faster than writing documentation. This holds until they leave, fall ill or go on parental leave, and the analytical capacity of the whole organisation is suddenly gone.
Statistics are scattered across Excel. Excel is a calculation tool that was promoted beyond its competence by necessity. When the statistics live in spreadsheets, reproducing them means rebuilding them. References break silently, the logic of a formula is invisible and updating the inputs needs manual work at every step. Asked how a number was obtained, the honest answer is often that it seemed right at the time.
There is no automatic pipeline. New data arrives, someone copies it into the right folder, opens the right script if they can find it, runs the steps in the right order if they remember them, checks the outputs if they know what to look for, and produces the results. Forty steps that a pipeline runs in minutes take a competent analyst two days, and an inexperienced one two weeks.
Make the analysis reproducible by someone who was not there when it was built.
Start with reusable pipelines. Write the workflow once as code in R, Python or whatever your team can maintain: every transformation, every test, every output format. Structure it so that running it on new data means changing one input path, not rebuilding the logic. The next person runs the script instead of relying on the analyst's memory.
Go further with reproducible notebooks. R Markdown and Jupyter combine code, results and explanation in one document, so when a funder asks how a metric was calculated, you send the notebook. The method is the document, and reproducibility stops being a claim and becomes something you can show. These open source environmental data tools are free, and your team can learn them.
Keep a small library of workflow notes for what does not fit in code: why you chose a statistical approach over the alternatives, what the odd filtering step handles, what the known data limits are and how you account for them. A README that explains the system to someone seeing it for the first time is enough. One hour of documentation prevents months of reverse engineering.
Schedule the routine runs. Weekly summaries, monthly trend updates and quarterly aggregates can run without anyone starting them. The analyst's job becomes reviewing the outputs and interpreting them, not repeating the same steps on a calendar reminder.
The programme rebuilt its analysis with documented pipelines and a workflow library. When the next analyst change came two years later, onboarding took ten days instead of eight weeks, and the quarterly report went out on time. The funder noticed the improvement without being told anything had changed.
Fragile analysis feels like a staffing problem: keep people longer, train them better, improve the handover. It is an infrastructure problem that makes people irreplaceable by accident. When analytical knowledge lives in people, losing people loses knowledge. When it lives in systems, people can leave without taking the organisation's capacity with them.
The technical change is not hard. The change is a habit: document as you build, not afterwards, and treat reproducibility as a deliverable. Every cycle that runs from a documented pipeline is faster than the one before, and over three or four years you have built an analytical asset instead of a liability. Your analysis should compound. Right now it probably resets.
Escaping Data Chaos
This article was first published in the Escaping Data Chaos series. The stories in the series are composites of real projects, anonymised.
Keep reading
Start here
Data In
Data Work
Data Out
Start here
From the case studies

Aquaculture and capacity building
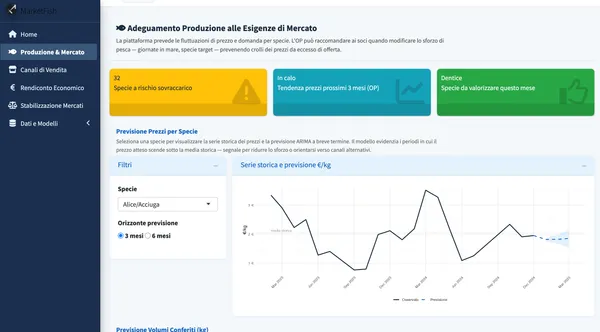
Fisheries, producer organisation
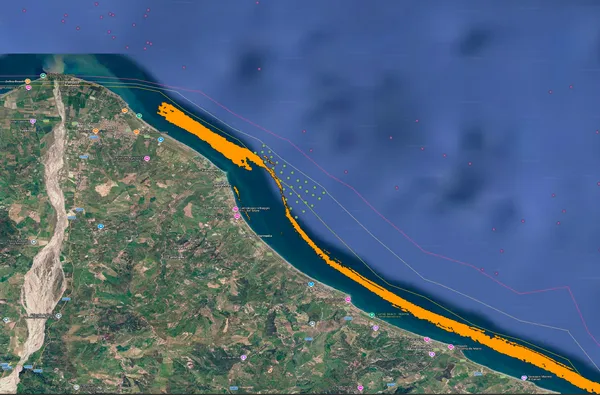
Marine protected areas and fisheries
Case studies
Where to go next