
Escaping Data Chaos
Also on LinkedIn
This article was first published in the Escaping Data Chaos series. The stories in the series are composites of real projects, anonymised.


Blog / Data Work
29 May 2026
The same report rebuilt from scratch every quarter, same charts, same indicators.
The analysis is done. The numbers are right and the science is solid. Now someone has to put it in the report, and somehow that takes three weeks. This is where accurate data disappears into a manual rebuild every quarter, using senior scientist time that should go to science. It is also the problem that environmental reporting software is built to solve.
A biodiversity monitoring programme had delivered quarterly donor reports for four years. That made twelve reports with the same structure, the same indicators, the same charts, the same tables and the same narrative sections. Every one took close to three weeks.
The process never changed. Pull the numbers from the database by hand. Copy them into Excel. Build the charts again, because last quarter's chart file was saved somewhere nobody could find. Reformat the tables to the donor template. Export the figures and place them in Word, then reformat because Word moved everything. Check the numbers against the database, because someone always finds a mismatch in review. Fix it, rebuild the affected charts, reformat again.
I asked the coordinator how many of those days involved real scientific thinking. She paused. "Maybe two," she said. "The rest is formatting." Two days of science and the rest formatting, repeated for forty eight reports.
Every report is built from scratch. The last report has the right structure, the right template and the right sections, yet the next one starts at zero, because updating it is almost as hard as rebuilding it. Charts are not linked to data and tables are retyped. The report is a document, not a system, and documents do not update themselves.
Charts are redrawn every time. Last quarter's chart showed exactly the right thing, and this quarter you need the same chart with one more data point. You rebuild it anyway. The file is missing, or it lost its data connection, or the person who made it used a different tool, or nobody is sure which version of the data it points to. This is invisible waste, because it feels like normal work.
Branding and formatting drift. The EU funder wants one format, the national ministry another, a foundation its own template. Each output is reformatted from the master by hand. When a number changes, and numbers always change in review, it has to be updated in every version. Sometimes it is, sometimes it is not, and the inconsistency only appears when someone puts two documents side by side.
There is no way to answer on demand. A funder calls with a question about one indicator. A partner needs a summary for tomorrow. A ministry wants updated figures for a briefing next week. If reporting is a three week manual process, the answer to all of them is "we will get back to you". Sometimes that costs a relationship, sometimes a grant, and always some credibility.
A report should take minutes, not weeks. The thinking takes time, and the production should be automatic.
Treat the report as a template with variables. Build the structure, the charts, the tables and the narrative frame once, and connect them to the data. Next quarter you update the data and run the template, and the document builds itself. R Markdown, Quarto and Python reporting tools do this well, and you build the template once.
Give stakeholders live dashboards instead of static PDFs. A PDF is right on the day it is produced and out of date when it is read. A dashboard connected to your database always shows current figures, so funders can check indicators when they need to and partners can follow progress without asking you. Open source tools such as Metabase or Apache Superset handle this without custom development, and good environmental data visualization is what makes them useful to people outside the team.
Keep one styling system. A master library holds your branding, your funders' required formats and your standard chart styles, with a prebuilt template for each output. Producing a new output means choosing a template, not reformatting a document, and a figure that appears in several outputs comes from one source, so corrections spread by themselves.
Schedule the routine outputs. Weekly summaries, monthly indicators and quarterly aggregates run on a timetable and reach the right people. The coordinator's job becomes reviewing the results and catching anomalies, not producing them.
The programme rebuilt its reporting with parameterised templates and a stakeholder dashboard. A quarterly report that used to take close to three weeks now takes a couple of days, and most of that is review. The coordinator used the time on analysis she had put off for two years. When a funder called in the middle of a quarter with a question about one indicator, she opened the dashboard and answered in four minutes. She told me she had forgotten what it felt like to think about the data instead of moving it around.
Slow reporting feels like a capacity problem: more staff, better templates, simpler formats for stakeholders. It is a systems problem that makes manual work the default because no automatic alternative exists. When reports need manual production, quality competes with frequency. Teams that should publish monthly publish quarterly, and teams that should answer in hours answer in weeks.
Automatic reporting changes that. Frequency becomes cheap and ad hoc questions become easy. The limit moves from production capacity to analytical thinking, which is where it should always have been. Your data is doing the work. Your reporting should too.
Escaping Data Chaos
This article was first published in the Escaping Data Chaos series. The stories in the series are composites of real projects, anonymised.
Keep reading
Start here
Data In
Data Work
Data Out
Start here
From the case studies
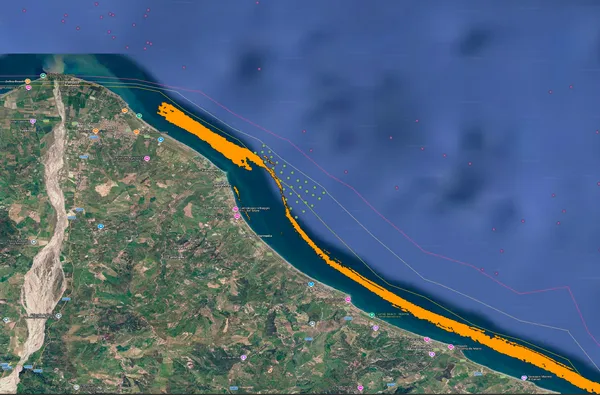
Marine protected areas and fisheries
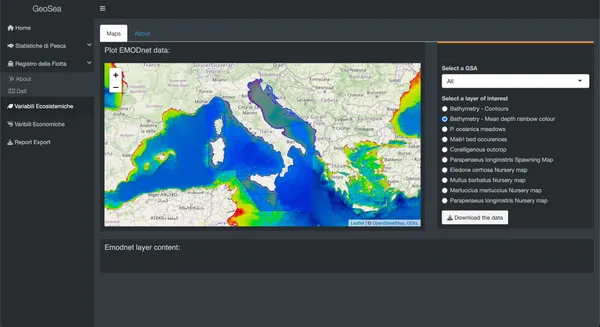
Marine science and fisheries management
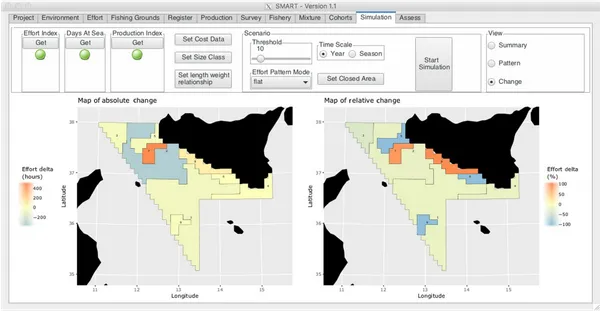
Fisheries management, EU research
Case studies
Where to go next