
Escaping Data Chaos
Also on LinkedIn
This article was first published in the Escaping Data Chaos series. The stories in the series are composites of real projects, anonymised.


19 February 2026
The framework behind the series: three heads, twelve problems.
Your team collects brilliant field observations. Your analysis is accurate. Your reports get delivered in the end.
So why does it feel like you always start from zero?
Because you are fighting three battles at once, and they are connected.
I have worked with marine research centres and biodiversity monitoring teams, and the pattern repeats. These organisations do not have "a data problem". They have three failures in environmental data management, and each one feeds the others. Fix one head and the other two keep biting.
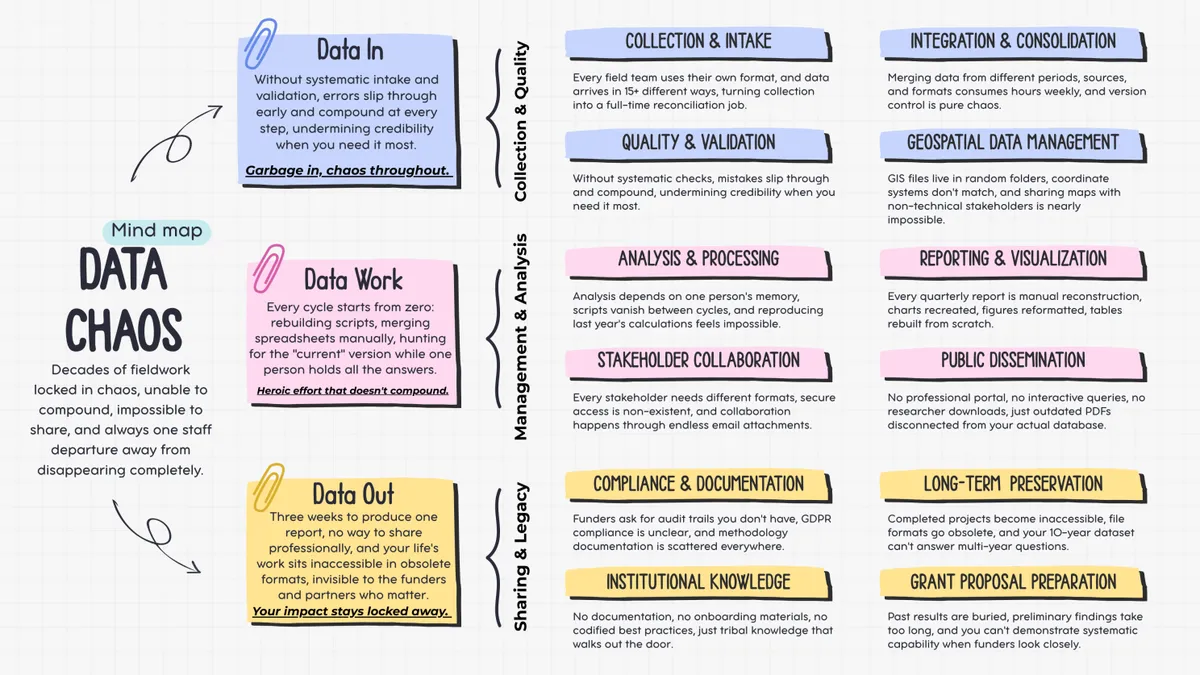
The chaos starts the moment data enters your system. Observations arrive in fifteen formats. One team uses Excel, another paper datasheets, a third sends photos from a phone. Without shared environmental data standards, species names are written three ways across three projects. GPS coordinates use different systems, and the notes on who collected what, when and where are gone.

By the time someone notices an error, it has spread. Without a systematic way to take data in and check it, mistakes enter early and grow at every step. The weak points are collection, quality checks, environmental data integration across sources and periods, and the handling of map files.
The data is clean. Now comes the part that eats your weeks. Every analysis starts from scratch. Last year's scripts are gone, the statistics are rebuilt by hand in Excel, and a report that should take an hour takes three weeks. One person knows how to do it, and when that person leaves, years of knowledge leave with them.

This head attacks your time. Its weak points are analysis and processing, working with stakeholders, reports and charts, and sharing data with the public. In each of them effort is spent and nothing is kept for the next cycle.
The science is excellent, but the way the data is presented makes you look like amateurs. Fieldwork sits in obsolete formats. Funders ask for documents you cannot produce. A deadline approaches and you cannot show what you did before. A key researcher leaves and their workflow disappears.

This head attacks your credibility. I have watched teams lose competitive grants not because their science was weak, but because they could not show a systematic capability fast enough. Its gaps are compliance and documentation, institutional knowledge, long term preservation and grant proposals.
They are not separate problems. They are three faces of the same gap in infrastructure. Poor intake forces manual cleaning, and manual cleaning makes professional sharing impossible. Then you cannot show your capability to funders, so you cannot get the resources to fix the intake. The loop feeds itself.
That is why fixing one head alone rarely works. You automate reporting but still spend weeks cleaning messy intake. You improve the collection forms but have nowhere professional to show the results. You build a beautiful dashboard that is not connected to your real database.
It is a failure of the whole system, not three technical glitches. It can be solved when all three are tackled together, so that good science becomes visible to the funders and partners who need to see it. The rest of the series looks at each head in turn.
Escaping Data Chaos
This article was first published in the Escaping Data Chaos series. The stories in the series are composites of real projects, anonymised.
Keep reading
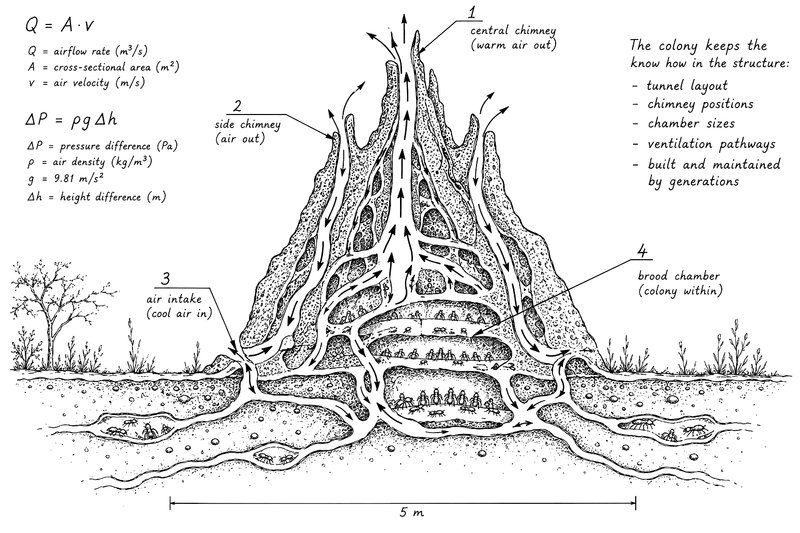
Start here
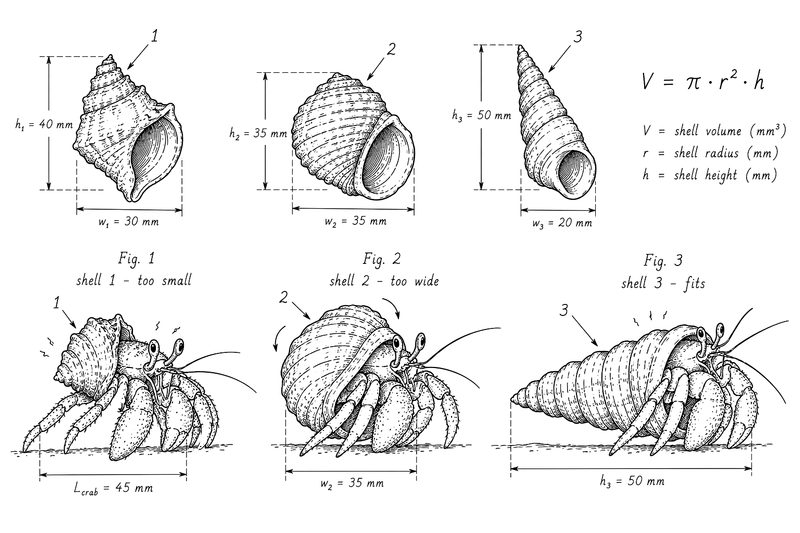
Data In
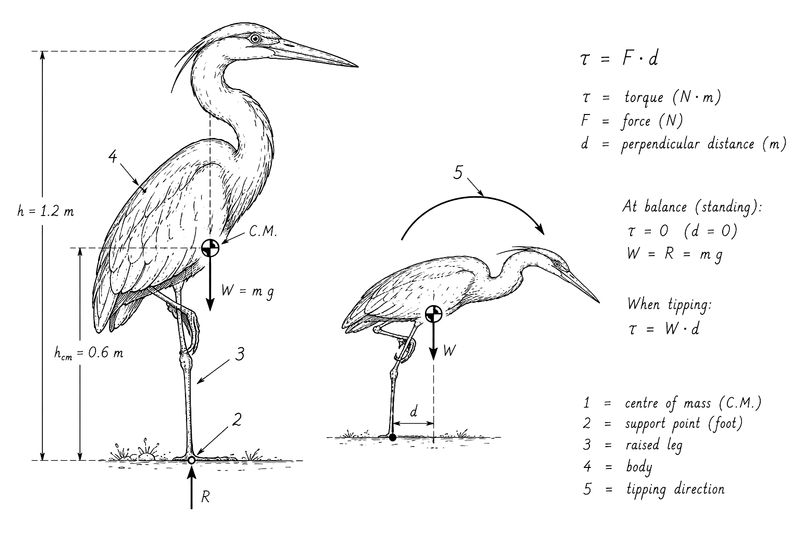
Data Work
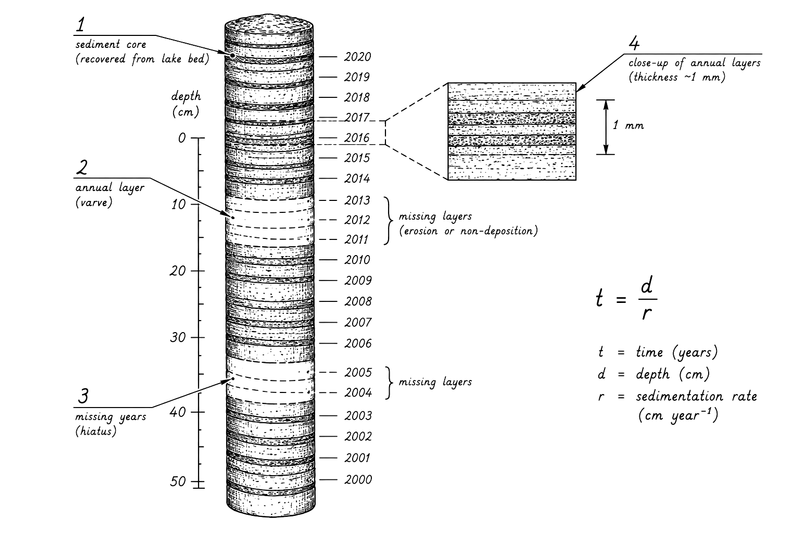
Data Out
Start here
From the case studies
Marine science and fisheries management
Fisheries management, EU research

Aquaculture and capacity building
Case studies
Where to go next