
Escaping Data Chaos
Also on LinkedIn
This article was first published in the Escaping Data Chaos series. The stories in the series are composites of real projects, anonymised.


Blog / Data Out
13 March 2026
Data Out: why your impact stays locked away.
The science is excellent. The way the data is presented makes you look like amateurs. Your fieldwork sits in obsolete formats. Funders ask for documents you cannot produce. A deadline approaches and you cannot show what you did before. A key researcher leaves and their workflow disappears.
This is not about research quality. It is about infrastructure that makes your expertise visible on demand. I have watched teams lose competitive grants not because their science was weak, but because they could not show a systematic capability fast enough. Here are the four gaps in getting data out, from EU environmental compliance data and documentation to grant proposals, and what fixes them.
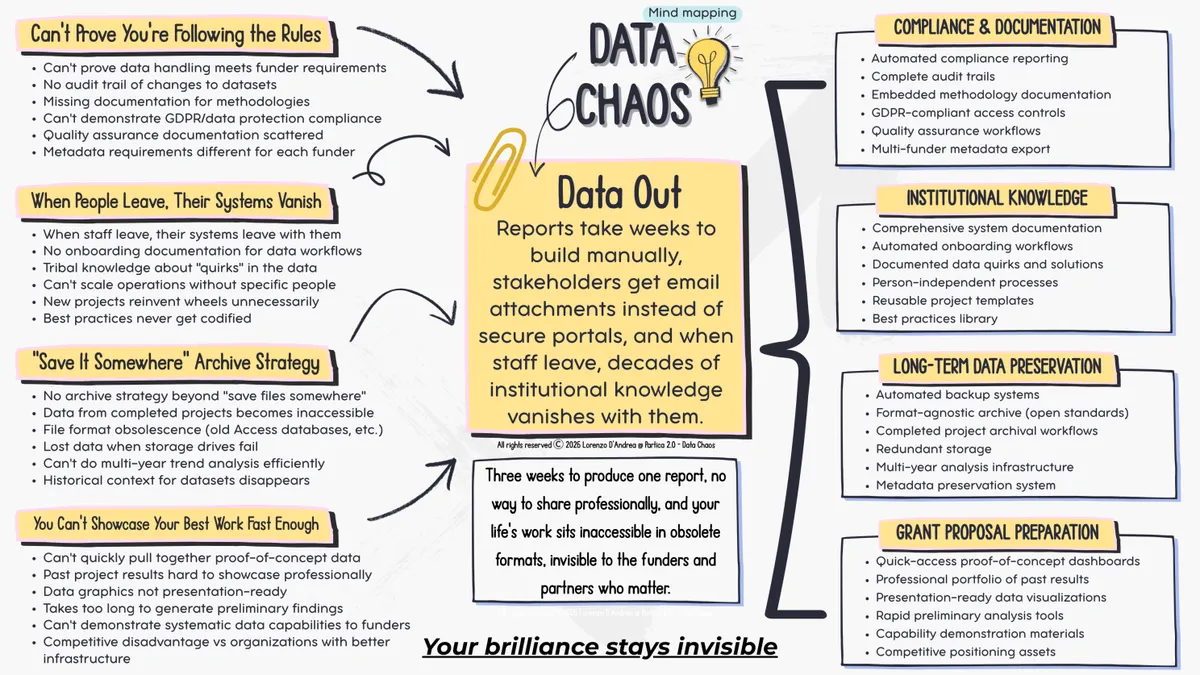
Funders ask for audit trails and EU environmental compliance data that you cannot document. GDPR compliance is unclear, methods are scattered, and the documentation requirements differ from funder to funder.
A conservation programme applied for a large EU grant. The application asked for documentation of its data quality assurance procedures. The programme had excellent practices, but had never written them down. They lived in email threads, in verbal training and in people's memory. The team spent three weeks rebuilding the documentation while the deadline came closer, and one researcher went through two years of emails to piece together the validation protocols. They submitted late, and the application was rejected on procedural grounds before anyone read the science. The science was solid. The documentation gap killed it.
The fix is one master compliance report. Write down your data handling once: quality checks, validation rules, access controls, retention and privacy measures. When a funder asks, you fill the gaps and adapt the text instead of starting from nothing. Audit trails come for free when your systems log everything by design.
When staff leave, their systems leave with them. There is no onboarding documentation, the quirks of the data are never written down, and new projects reinvent the wheel.
A marine research centre lost its database administrator to a university post. She was the only person who understood the whole data architecture, and nothing was documented. Her replacement spent four months just working out where the data was stored and how the tables connected. In the meantime new field data piled up unprocessed, because nobody knew how to run the intake pipelines. Ten years of sophisticated infrastructure had lived in one person's head, and the centre was back to spreadsheet chaos overnight.
The fix is to document your most critical workflow this month. Write one README that explains how the system really works: where data comes from, how it is processed, where outputs go and what can go wrong. When the next person has to run it, they read the file instead of guessing. Knowledge becomes documentation instead of risk.
There is no archive strategy beyond saving files somewhere. Completed projects become inaccessible, file formats become obsolete and drives fail.
A biodiversity monitoring programme had fifteen years of species distribution data and wanted to study climate effects. The first five years were in Microsoft Access databases from the late 2000s. The software was obsolete, nobody on the team knew how to open the files, and the person who built them had retired. The programme paid a consultant to extract the data. Half the metadata could not be recovered, because it lived only in table comments that the export did not keep. Fifteen years of data became ten, because the first five were too degraded to trust.
The fix is to pick your three most valuable datasets and export them to open formats with full metadata. Use CSV for tables, GeoJSON for spatial data and plain text for documentation, and store copies in more than one place. When formats change, your data stays readable. Start small and extend step by step.
Past results are buried and slow to find. When funders look closely, you cannot show a systematic capability, and your graphics are not ready to present.
A coastal research programme heard about a major grant with a three week window. It fitted their expertise well, and they had relevant preliminary data from five finished projects. It took them twelve days just to find and assemble the supporting data. They had to find the files, work out which analysis version was final, redraw figures in presentation quality and put numbers in the right format. That left four days to write the proposal, and they submitted something rushed. A competitor with organised data and ready demonstrations sent a polished application in week one and used week two to refine the science. The competitor won.
The fix is one professional dashboard of your best results. When an opportunity appears, you answer in hours instead of weeks. Keep a library of presentation quality figures and data summaries you can adapt, so your time goes into science and strategy, not into hunting for files.
Your science deserves infrastructure that makes it visible, not invisible. These four gaps share one cost: they hide your expertise exactly when it matters, from funders reviewing proposals, from partners weighing a collaboration, from researchers who want your data and from the next generation of staff learning your methods.
The work is excellent. The systems make it look amateur. Organisations with strong systems respond faster to opportunities and show their capability on demand, because their infrastructure is as professional as their science. You can have both, but it means treating environmental data management as a core capability, not as technical overhead.
Start with grant proposals. Build one professional dashboard of your best results, and when an opportunity comes you will answer in hours. That single capability changes how funders see your organisation.
That is the series: three heads of the data chaos monster, twelve breaking points and a practical fix for each.
Escaping Data Chaos
This article was first published in the Escaping Data Chaos series. The stories in the series are composites of real projects, anonymised.
Keep reading
Start here
Data In
Data Work
Data Out
Start here
From the case studies
Marine protected areas and fisheries

Aquaculture and capacity building
Marine litter, citizen science
Case studies
Where to go next