
Escaping Data Chaos
Also on LinkedIn
This article was first published in the Escaping Data Chaos series. The stories in the series are composites of real projects, anonymised.


Blog / Series
20 March 2026
The governance and architecture framework behind the series.
Environmental research organisations face a problem that rarely has a name: data chaos. It has many sources and many symptoms, and it slows decisions and weakens the quality and reach of the research. This post sets out what data chaos is, where it comes from and the environmental data management strategy that turns it into clarity. It is the framework behind the whole series.
Data chaos is disorder in the data landscape. Silos block a single view of what you hold, inconsistent formats make analysis slow, and the lack of a clear architecture leads to results nobody quite trusts. When data is fragmented and unreliable, analysis takes longer and errors creep in, insight arrives late and decisions get weaker. Without recent data it is also harder to respond to new environmental problems.
Collection comes first. Different methods, different formats and no shared process produce raw data that is hard to merge and hard to analyse. Add weak rules about who owns, checks and shares the data, and no automated flow between systems, and the landscape stays fragmented however good the field work is.
The first part is governance. Set clear rules for data quality and integrity, for access and sharing, and for privacy. Good governance protects sensitive information and builds trust with stakeholders, and it is the base on which the other parts stand.
The second is one architecture. Bring your sources together in a single system, whether you call it a warehouse or a lake, so that data is ready for analysis and decisions. This is environmental data integration: field observations, remote sensing and laboratory results in one place. It works when you agree on environmental data standards, so that every source is written in the same format before it arrives.
The third is automated pipelines. A pipeline carries data from each source into the central store and transforms, checks and loads it on the way. Build one by mapping your sources, defining the transformations and checks, choosing tools to automate the work and adding monitoring and alerts, so that a problem is noticed when it happens and not months later.
The fourth is analysis you can trust. Clean the data, remove duplicates, fix errors and standardise formats. Then use suitable statistical methods, validate the results, document the process and say what the data cannot tell you. Analysis only improves decisions when the steps before it are sound.
Three trends shape the future of this work: automated workflows, real time data and advanced analytics. Organisations that want to keep up need flexible infrastructure that can grow, clear governance and a habit of working with data. The rest of the series looks at the three places where all this breaks in practice, one head at a time.
Escaping Data Chaos
This article was first published in the Escaping Data Chaos series. The stories in the series are composites of real projects, anonymised.
Keep reading
Start here
Data In
Data Work
Data Out
Start here
From the case studies
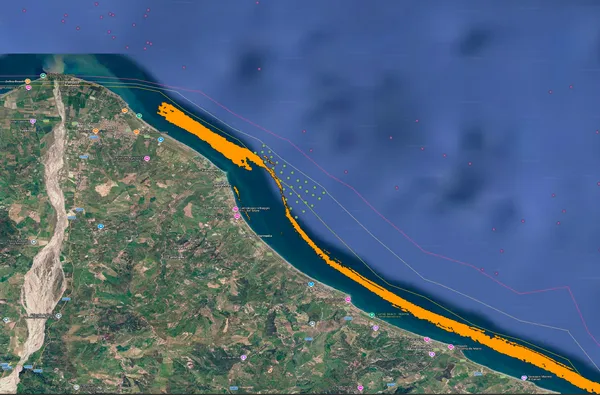
Marine protected areas and fisheries
Aquaculture and capacity building
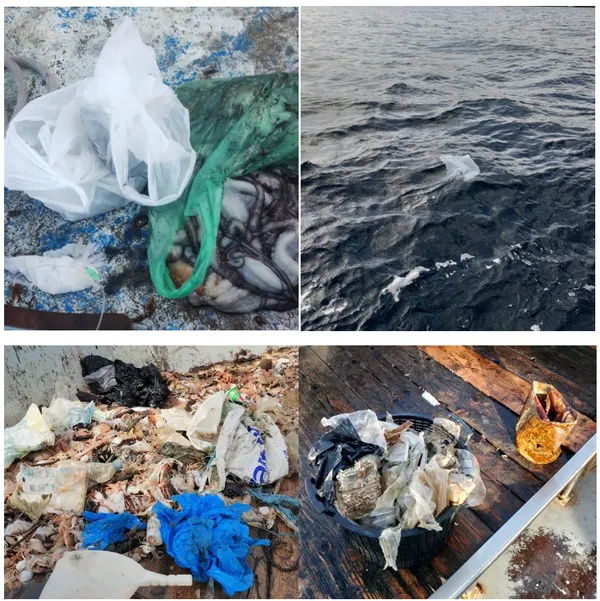
Marine litter, citizen science
Case studies
Where to go next